


The 122nd episode of Datacast is my conversation with Gabi Steele - the co-founder and co-CEO of Preql, a no-code data transformation tool that empowers business users to model and manage their own metrics.
Our wide-ranging conversation touches on her entrance into data visualization by way of graphic design; her early career at the Washington Post; her time at WeWork launching the Data Cult initiative; her first company Data Culture that helps organizations build data capabilities, implement modern infrastructure and create lasting data culture; her current journey with Preql building the future of data transformation; lessons learned building diverse teams; and much more.
Please enjoy my conversation with Gabi!
Show Notes
(01:33) Gabi shared her professional interests growing up - from painting and drawing to graphic design.
(04:44) Gabi touched on her entrance to the field of data visualization.
(06:30) Gabi described her graduate school experience studying Data Visualization at Parsons School of Design.
(08:50) Gabi talked about the benefits of teaching data visualization classes later in her career.
(12:30) Gabi recalled working as a Data Visualization specialist at The Washington Post.
(14:50) Gabi gave her perspective on the evolution of data journalism.
(18:29) Gabi talked about her experience co-founding Raw Haus, a creative community bringing together emerging talent in design, technology, and entrepreneurship.
(21:20) Gabi emphasized the magic of community gatherings.
(23:51) Gabi reflected on her time at WeWork as a senior data visualization engineer to design and build graphics, dashboards, and tools that tell stories using data.
(28:02) Gabi walked through the evolution of the Data Cult initiative - which she co-created with Leah Weiss.
(31:44) Gabi recalled her decision to leave WeWork in early 2020 and start Data Culture - a data engineering and visualization consultancy focused on helping organizations build data capabilities, implement modern infrastructure and create lasting data culture.
(36:31) Gabi unpacked Data Culture's well-defined blueprint for each client engagement.
(39:21) Gabi explained how Data Culture leveraged tools in the modern data stack for its consulting services.
(40:42) Gabi brought up Data Culture's Studio - which offers data storytelling and visualization services to mission-aligned organizations.
(42:50) Gabi reviewed her experience working with Kode with Klossy to empower young scholars to solve important issues using data science.
(46:13) Gabi shared her perspective on how companies can scale their respective data cultures.
(49:52) Gabi shared the story behind the founding of Preql.
(52:59) Gabi touched on the process of working with design partners for Preql.
(56:42) Gabi shared valuable hiring lessons to attract the right people at Data Culture and Preql.
(58:10) Gabi provided her perspective on building a diverse team.
(01:00:57) Gabi shared fundraising advice to data founders who are seeking the right investors for their startups.
(01:03:34) Closing segment.
Gabi's Contact Info
Preql's Resources
Introducing Preql: The Future of Data Transformation (April 2022)
Mentioned Resources
People
Umi Syam (Graphics and Multimedia Editor at the New York Times)
Giorgia Lupi (Information Designer and Partner at Pentagram)
Susie Lu (Senior Data Visualization Engineer at Netflix)
Book
Invisible Women: Exploring Data Bias in a World Designed for Men (by Caroline Criado Perez)
Notes
My conversation with Gabi was recorded back in August 2022. Since then, Preql has officially launched and currently supports strategy and operations teams at B2B and vertical SaaS companies!
About the show
Datacast features long-form, in-depth conversations with practitioners and researchers in the data community to walk through their professional journeys and unpack the lessons learned along the way. I invite guests coming from a wide range of career paths — from scientists and analysts to founders and investors — to analyze the case for using data in the real world and extract their mental models (“the WHY and the HOW”) behind their pursuits. Hopefully, these conversations can serve as valuable tools for early-stage data professionals as they navigate their own careers in the exciting data universe.
Datacast is produced and edited by James Le. For inquiries about sponsoring the podcast, email khanhle.1013@gmail.com.
Subscribe by searching for Datacast wherever you get podcasts, or click one of the links below:
If you’re new, see the podcast homepage for the most recent episodes to listen to, or browse the full guest list.
Key Takeaways
Here are the highlights from my conversation with Gabi:
On Her Professional Interests
I moved from London, England, to New York as a teenager. I studied industrial design at Brooklyn Technical High School for Science and Engineering. I took figure drawing classes at Parsons in high school, which sparked my interest in the creative arts. Despite not knowing what to study in university, I knew I wanted to focus on creative, open-ended subjects.
I attended Western University in Canada, majoring in fine arts and specializing in painting and drawing, particularly oil painting. However, I realized after university that I didn't want to be an artist and instead pursued graphic design at Parsons. While working in fashion and advertising, I hit a wall because I couldn't build the designs I was creating and felt like I wanted to do something more meaningful and impactful.
Parsons then introduced a new degree in data visualization, which I joined as part of the first cohort for a master of science in data visualization. This put me on the path to becoming an evangelist for data visualization, as many people at the time were unfamiliar with the field. Despite not knowing my next step, I remained open-minded about applying creativity to any industry or field.
On Getting Into Data Visualization
I have always been a multidisciplinary enthusiast. Leah and I have carried this perspective in all of our companies, which has been reflected in our work. The idea of doing only one thing forever has never appealed to me.
Data visualization is so interesting because it combines several things I love. It allows me to be creative while also accessing super interesting stories and storytelling content. If I had to describe my most impactful skill, it would be communication. I excel at storytelling, accessing others' stories, and telling them in interesting ways. Data visualization is the perfect way to do this and has allowed me to develop new skills. I had never learned front-end engineering before, nor had I really written SQL or done any data structuring. Although I studied some statistics during my undergraduate years, it never really panned out until I pursued this degree.
I like data visualization because it combines multiple disciplines while also being something brand new. Additionally, it ties into this idea of telling stories and communicating messages.
On Her Time at Parsons School of Design
Parsons is an amazing place to be, especially in a program focused on engineering and data, which was really exciting for me.
While there, I had access to the multidisciplinary courses offered by another program, the MFA in Design & Technology. During that time, I also connected with an amazing organization called Open Style Lab, which focuses on creating wearable technology for people of all abilities. The organization was initially started at MIT and then brought to Parsons by Grace Jun, who is still a close friend. I volunteered for them and got really involved in some of their studies.
I remember taking a class during that time in partnership with NYU's journalism school, which focused on storytelling, journalism, and code. The professors were also really exciting. The most interesting things happen when you bring together people from different spaces.
Unfortunately, the data engineering world is not that diverse. It's one thing that I've dedicated a lot of time in my career to trying to change, specifically in the data space. When the people that are touching data about a population are not representative of that population, nothing good can come of it. But the experiences I had at Parsons pushed me in the direction that has led me to where I am now, which is really exciting.
On The Benefits of Teaching
Currently, there is no Ph.D. in data visualization. When I graduated, I was immediately recruited to speak at conferences and share my thoughts on the field and industry. I spoke at Google and Amazon and even gave a talk on a television show for Microsoft in Seattle. Eventually, I became an instructor and developed a certificate program at Parsons to make the field more accessible. I also taught at Columbia and had discussions with NYU.
Teaching is special to me because it's a way to give back and bring more voices into the field. In general, data engineering, data science, and data fields need more perspectives. It's an actionable way to bring more people into the space and make things more accessible. As someone who came to engineering and coding later in my career, I especially enjoy it.
My most impactful teaching experience was with the Kode with Klossy organization during the pandemic. One of the first partnerships Leah and I had when we started Data Culture was teaching 13 to 19-year-olds data science on Zoom. It was difficult but also the most rewarding.
Teaching in graduate school and bringing more voices into the professional space was a stepping stone for me to do a lot of other teaching. Data Culture was the first successful consultancy that Leah and I built. Learning, education, and teaching were the organization's core tenants, and everyone we hired shared that message. It continues to be our priority to bring more voices into the space.
As someone in the industry, I feel a responsibility to bring more people into it and show that it's possible to join the industry without having years of computer science education or attending a specific school from a young age.
On Her First Job at The Washington Post
I worked on a team in New York that was selling branded content. This was a segue from the advertising side, and I also collaborated with folks in the newsroom in Washington and went there quite frequently. It was an amazing experience but also a bit tragic because it was during the 2016 election. Walking into the Washington Post the day after, seeing my teammates in tears, and sharing that experience was incredible but also painful and difficult.
However, I think data visualization is an industry that works best through the lens of journalism. The Washington Post, the New York Times, Vox, and the Wall Street Journal have created amazing pieces using D3JS JavaScript for data visualization. Although Tableau dashboards and business intelligence tools are more common forms of data visualization, the ability to share stories with broad audiences in a cutting-edge technical way makes it so special. Designing work like the arrows that lit up to show who was going to win the election was a very interesting time.
I had some incredible leaders at the Washington Post that I could look up to, and there was a lot of exciting work coming out of there. Starting my career in the journalism space was an amazing decision and allowed me to apply the learnings from my master's degree in a very real sense.
Working at the Washington Post during that time was an amazing experience and definitely one of the best decisions I made straight out of that program.
On The Evolution of Data Journalism
I could talk about data journalism for a long time. When I give data visualization lectures, I often reference pieces that were worked on when I was at the Washington Post and prior. There's something about data visualization journalism that's timeless. The amount of work and effort that goes into designing a web page or any kind of interactive visualization is far beyond what usually goes into a basic infographic or written pieces. These pieces can take six to eight weeks or longer to develop and can be worked on for years.
What's exciting is that they actually do last for years because the level of user experience and the different design components and writing make them interesting. Often, graphic editors working on these pieces become celebrities in data visualization. I have a good friend who is still a graphic editor at the New York Times. She writes all of the articles and designs the code.
Data journalism is a unique skill set and an evolution of journalism. From the past hundred years of journalism being written and printed work, we have moved to digital and digital interactive work. We're moving even further in that direction with video and the layering of video through data visualization pieces, which brings the work to life and makes it more accessible to broader audiences.
A lot of work goes into thinking about how users will learn to engage with these pieces because every piece is unique. It's not like a website they return to every day. So, how do you get them to engage in the right way and teach them what to click on and what to look at? This involves social psychology, human-centered interaction design, and it's an exciting space.
I'm still super passionate about it and follow it very closely. Amazing organizations like The Pudding and Polygraph are at the forefront, and I've collaborated with them through Data Culture. I've also hired many people from that space at different companies I've started.
On Co-Creating Raw Haus
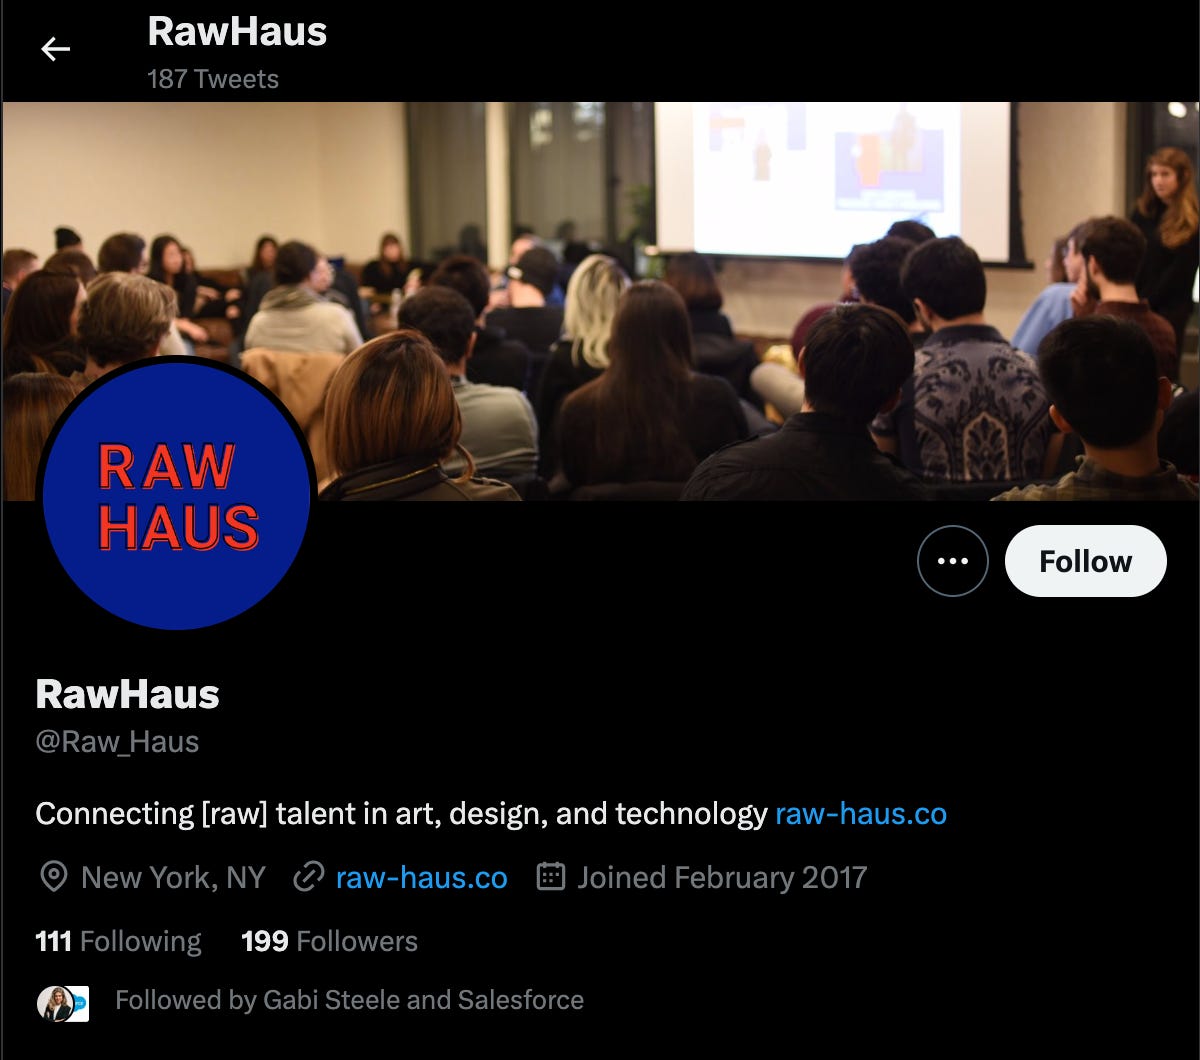
I love talking about Raw Haus but don't get to talk about it enough.
It was the first company I ever founded, co-founded with my friend Amy Jung, who attended my wedding a few months ago and whom I hope to see soon. We met while I was studying at Parsons and volunteering part-time for an accelerator that focused on retail and other things.
Through our experiences, we realized that designers and engineers were curious about each other's industries but had a hard time connecting. To bridge this gap, we founded Raw Haus and started hosting in-person monthly events in New York City (and a bit in San Francisco) to bring together people from all over the industry. We invited professionals to speak about their experiences and did a lot of support in hiring and talent.
Over 10 months, we hosted more than 10 events and cultivated a community of over 2,000 people from all backgrounds. We activated spaces like WeWork and creative spaces to provide a unique, in-person experience. It was an exciting time, especially as I was also working at The Post and seeing a lot of young, diverse talent emerging in the industry.
Although Raw Haus slowed down when I left The Post to work at WeWork, the community lives on. Bringing multidisciplinary thinkers together is one of the most powerful things in the design and technology industry, and that's what Raw Haus was all about. Although we never monetized it, we had a lot of success placing people in new roles and helping top talent find new opportunities.
On Community Gatherings
COVID has obviously dramatically changed the way we gather. One of my favorite things about living in New York City is the common practice of in-person networking at breakfasts and after-work gatherings. There's just something special about it.
While there have been attempts to replicate this online, such as the recent Burning Man event with high turnouts, I found Data Culture's monthly online events with 100+ attendees to be a powerful substitute during the pandemic. While gathering in person is powerful, it's not limited to physical spaces.
Creativity thrives when you connect with people outside your typical environment. With my newest company, Preql, we now hold quarterly off-site events to gather everyone together. As things get safer, I'm passionate about continuing to connect with people in person, whether in a professional context or not.
However, productivity can still happen online. Both of my companies, Data Culture and Preql, are fully remote-friendly. While Data Culture is entirely remote, Preql has offices in New York and a flexible team in Austin, San Francisco, and beyond.
In summary, I believe a blend of in-person and online gatherings works best. I'm passionate about the power of gathering people for shared experiences, whether it's for conferences, learning, or simply connecting with others. Having a clear purpose for these gatherings can also make them more effective than just throwing people into a room for drinks.
On Her Time at WeWork
At a certain point in my career at the Washington Post, I realized I wanted to work in New York-based journalism. I started applying for roles, and through that process, I connected with a recruiter on LinkedIn who was terrific. She found me via WeWork and contacted me about starting a data visualization engineering team. At the time, WeWork was valued at over 40 billion and had 2,000 employees. They were starting all sorts of different teams, and it was a really creative place. Leah Weiss, my co-founder now, was the hiring manager for the role.
We spoke on the phone and connected immediately. Leah had also been in the humanities, studying German and history in her undergraduate years before getting into coding. She had led all sorts of versions of the data team at WeWork and was one of their earliest employees. She said to me, "Listen, like whatever you want to do here, we can make it happen. Data visualization is one thing, but the need for us to make data more accessible and tell stories with it is really a requirement. It's something this company needs more than anything."

I was recruited as a data visualization engineer, but I hadn't been coding for a few years since the master's program. However, I was excited to go back to the engineering stuff. I ended up building an amazing partnership with Leah, which absolutely changed my life and career. We spent an amazing couple of years at WeWork, teaching people how to leverage data to solve problems and designing different visualization projects. We also created our own educational programs and did more of that at work.
We had the opportunity to work on many projects, including constructing a building and developing innovative products for the company where internal folks could better leverage data and create dashboards and visualization prompts for the CEO. WeWork was one of those places where you could get up and do whatever you wanted to do. If others believed in the project, you were given the resources to make it happen. It was my best professional experience and definitely the professional experience that led me to fully go deep into this entrepreneurship space.
When Leah and I left WeWork, we decided to found a company and were already on that path. We had been intrapreneurs there, starting our own mini-companies within. We also realized that there was no other organization we'd want to work for, so we had to create our own and fill the gaps. We spent a fantastic couple of years flying all over the world with WeWork, teaching people about data in Singapore, Shanghai, London, and Mexico City. It was an exciting time, and I'm so grateful for that experience.
On Launching The Data Cult Initiative

I mentioned that Leah recruited me to join her team at WeWork. When I arrived, I went through an onboarding program called Data Cult, which Leah had developed with a colleague. During the first two weeks, we had to use data to solve a problem worth either 10 million or 1 million for the business and build a product. This initiative was designed to help the data team better access all of the schemas and relevant metrics within the organization.
I loved this program because it was the first time anyone had asked me what problem I wanted to solve. I came up with a project based on my experience in education, and Leah and I decided that every employee should have access to this initiative. So we wrote a new curriculum and invited colleagues from different teams to come into a room to learn SQL and develop their products.
We started with three people in a room in the HQ in New York, but the program quickly took off. We ran it once a quarter in New York and on the road, eventually running 14 or 15 cohorts of the program over a couple of years. We traveled all over the world to train employees in cities like Singapore, Shanghai, London, Mexico City, and Tel Aviv.
Solving 10 million in one project seems complicated, but it was actually not that hard. The company was leaving money on the table in more ways than we knew then, and the program was tied to revenue. We received recognition for our work, and it was the best work we had done. Once the program was successful, we knew we wanted to continue this partnership.
We started running the program for companies WeWork had acquired, such as Meetup.com and Flatiron School. These relationships helped us start our own company, Data Culture. It was a natural fit, and we were well-equipped to make the transition.
On Starting Data Culture
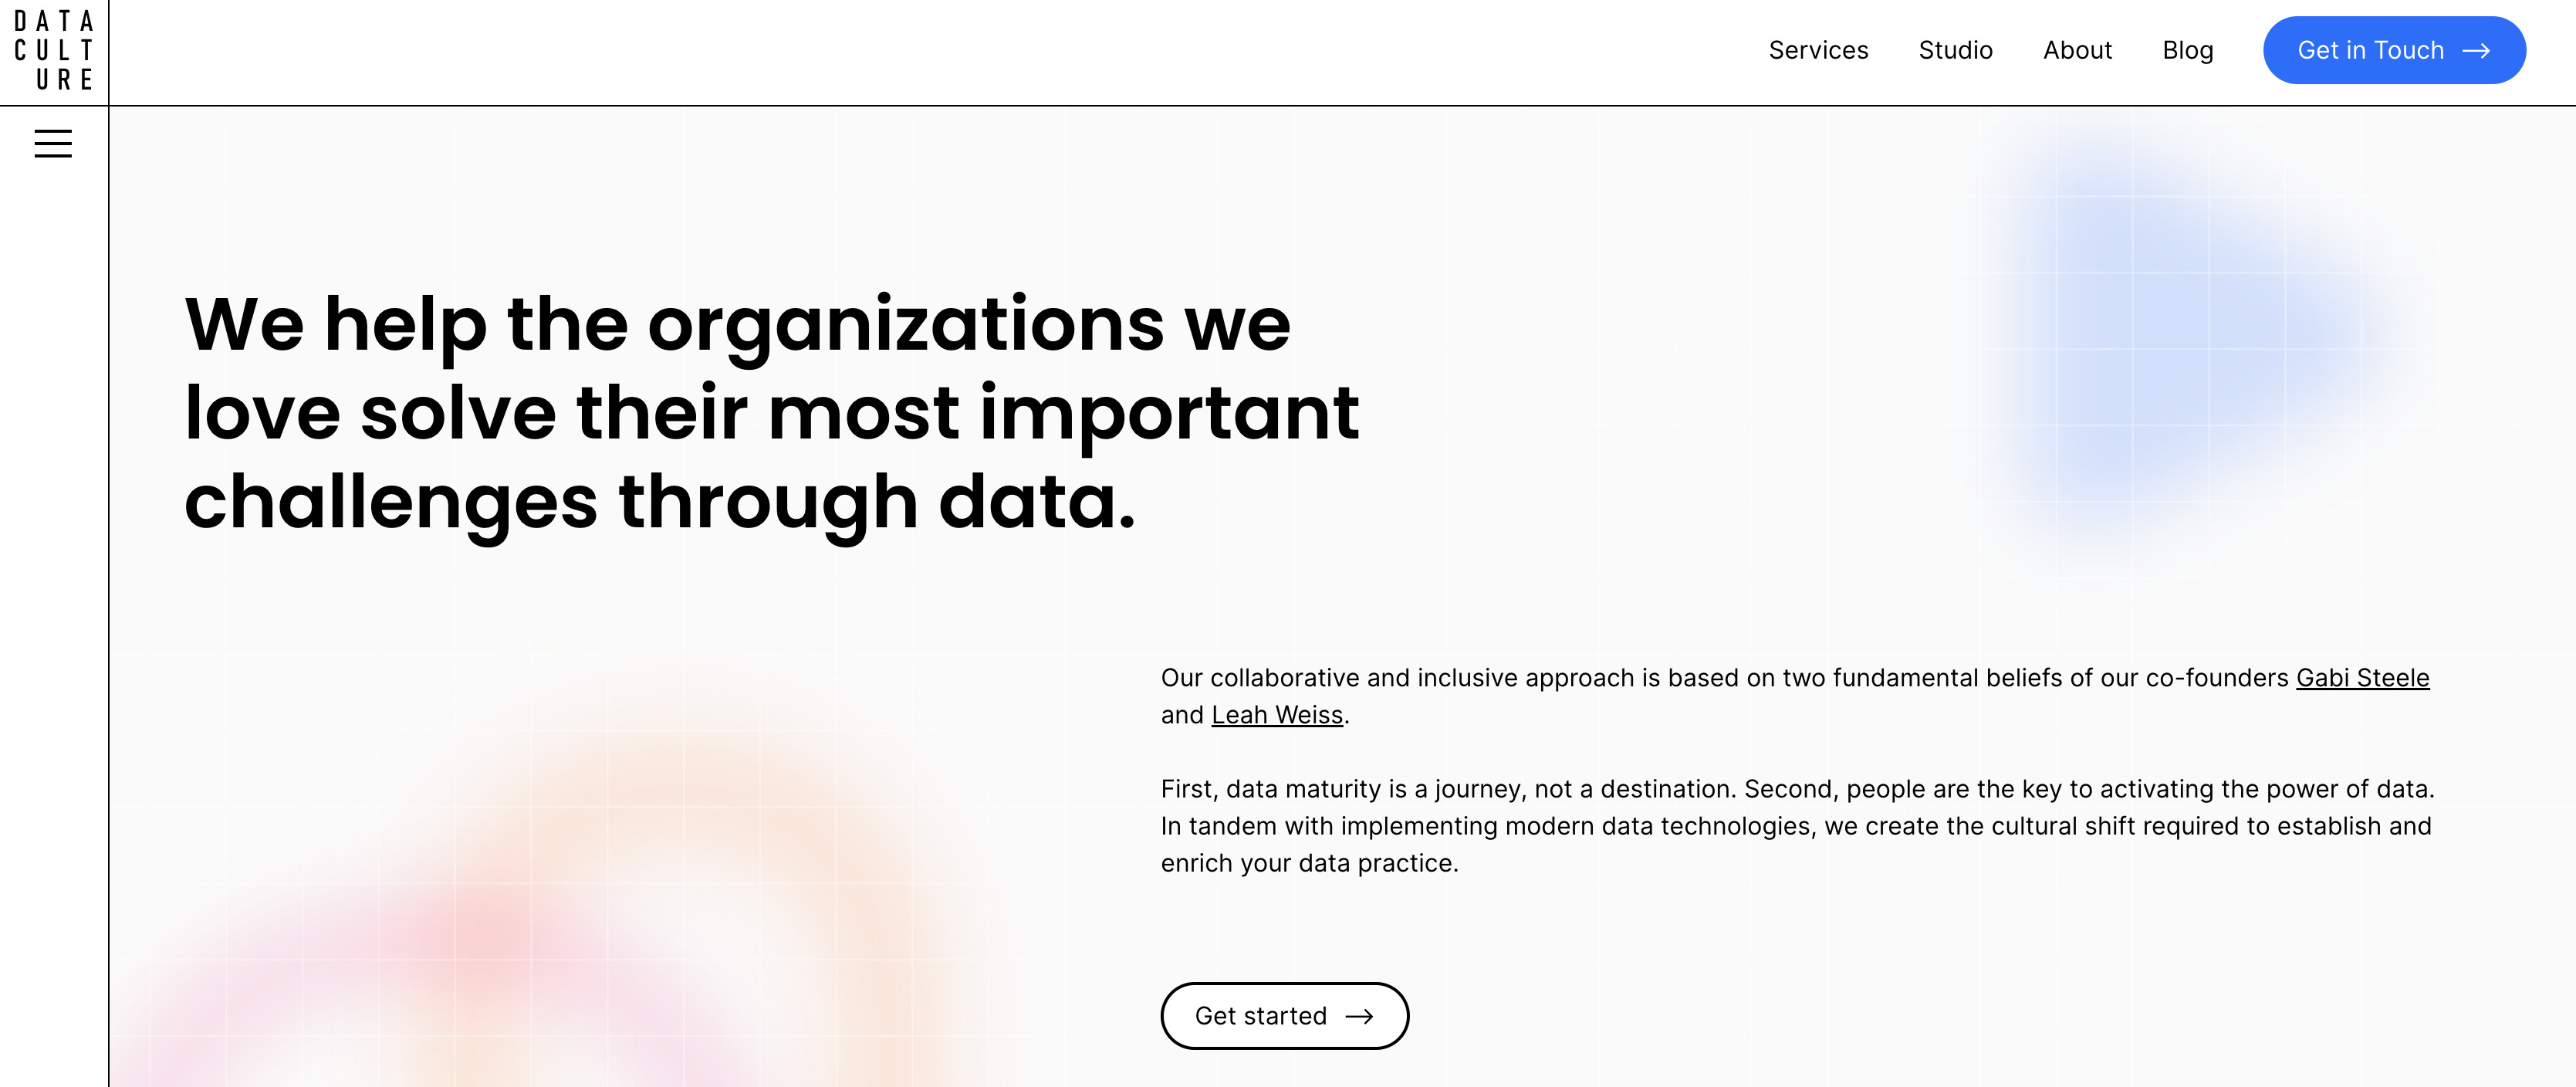
In 2019, we left WeWork. We couldn't find another company that matched our culture and provided the same flexibility. So, we founded Data Culture as an LLC and started pinging our old colleagues for project ideas. I focused on selling data and visualization engineering services, while Leah was experienced in setting up modern data stacks and infrastructure. Our first two projects were an educational data science program for 13-19-year-olds with Kode with Klassy and a venture capital firm that wanted to visualize diversity and inclusion data from their portfolio companies.
Soon after, the pandemic hit, and we started helping companies set up their modern data infrastructure. Many organizations struggle to leverage data for decision-making because they lack the technology or don't know how to use it. We quickly grew our business, hiring 15 employees and working with over 40 companies by the end of 2021.
We realized that most of our engineering hours were spent modeling data in the form of metrics, which felt custom and unique to each organization but were quite similar across different companies in the same vertical. We started reusing code internally and eventually turned this into a product, Preql. We raised 7 million from Bessemer and Felicis and hired a CEO to run Data Culture. Now, we're focused on building Preql, which is a data transformation solution for business users.
On Data Culture's Client Engagement Blueprint
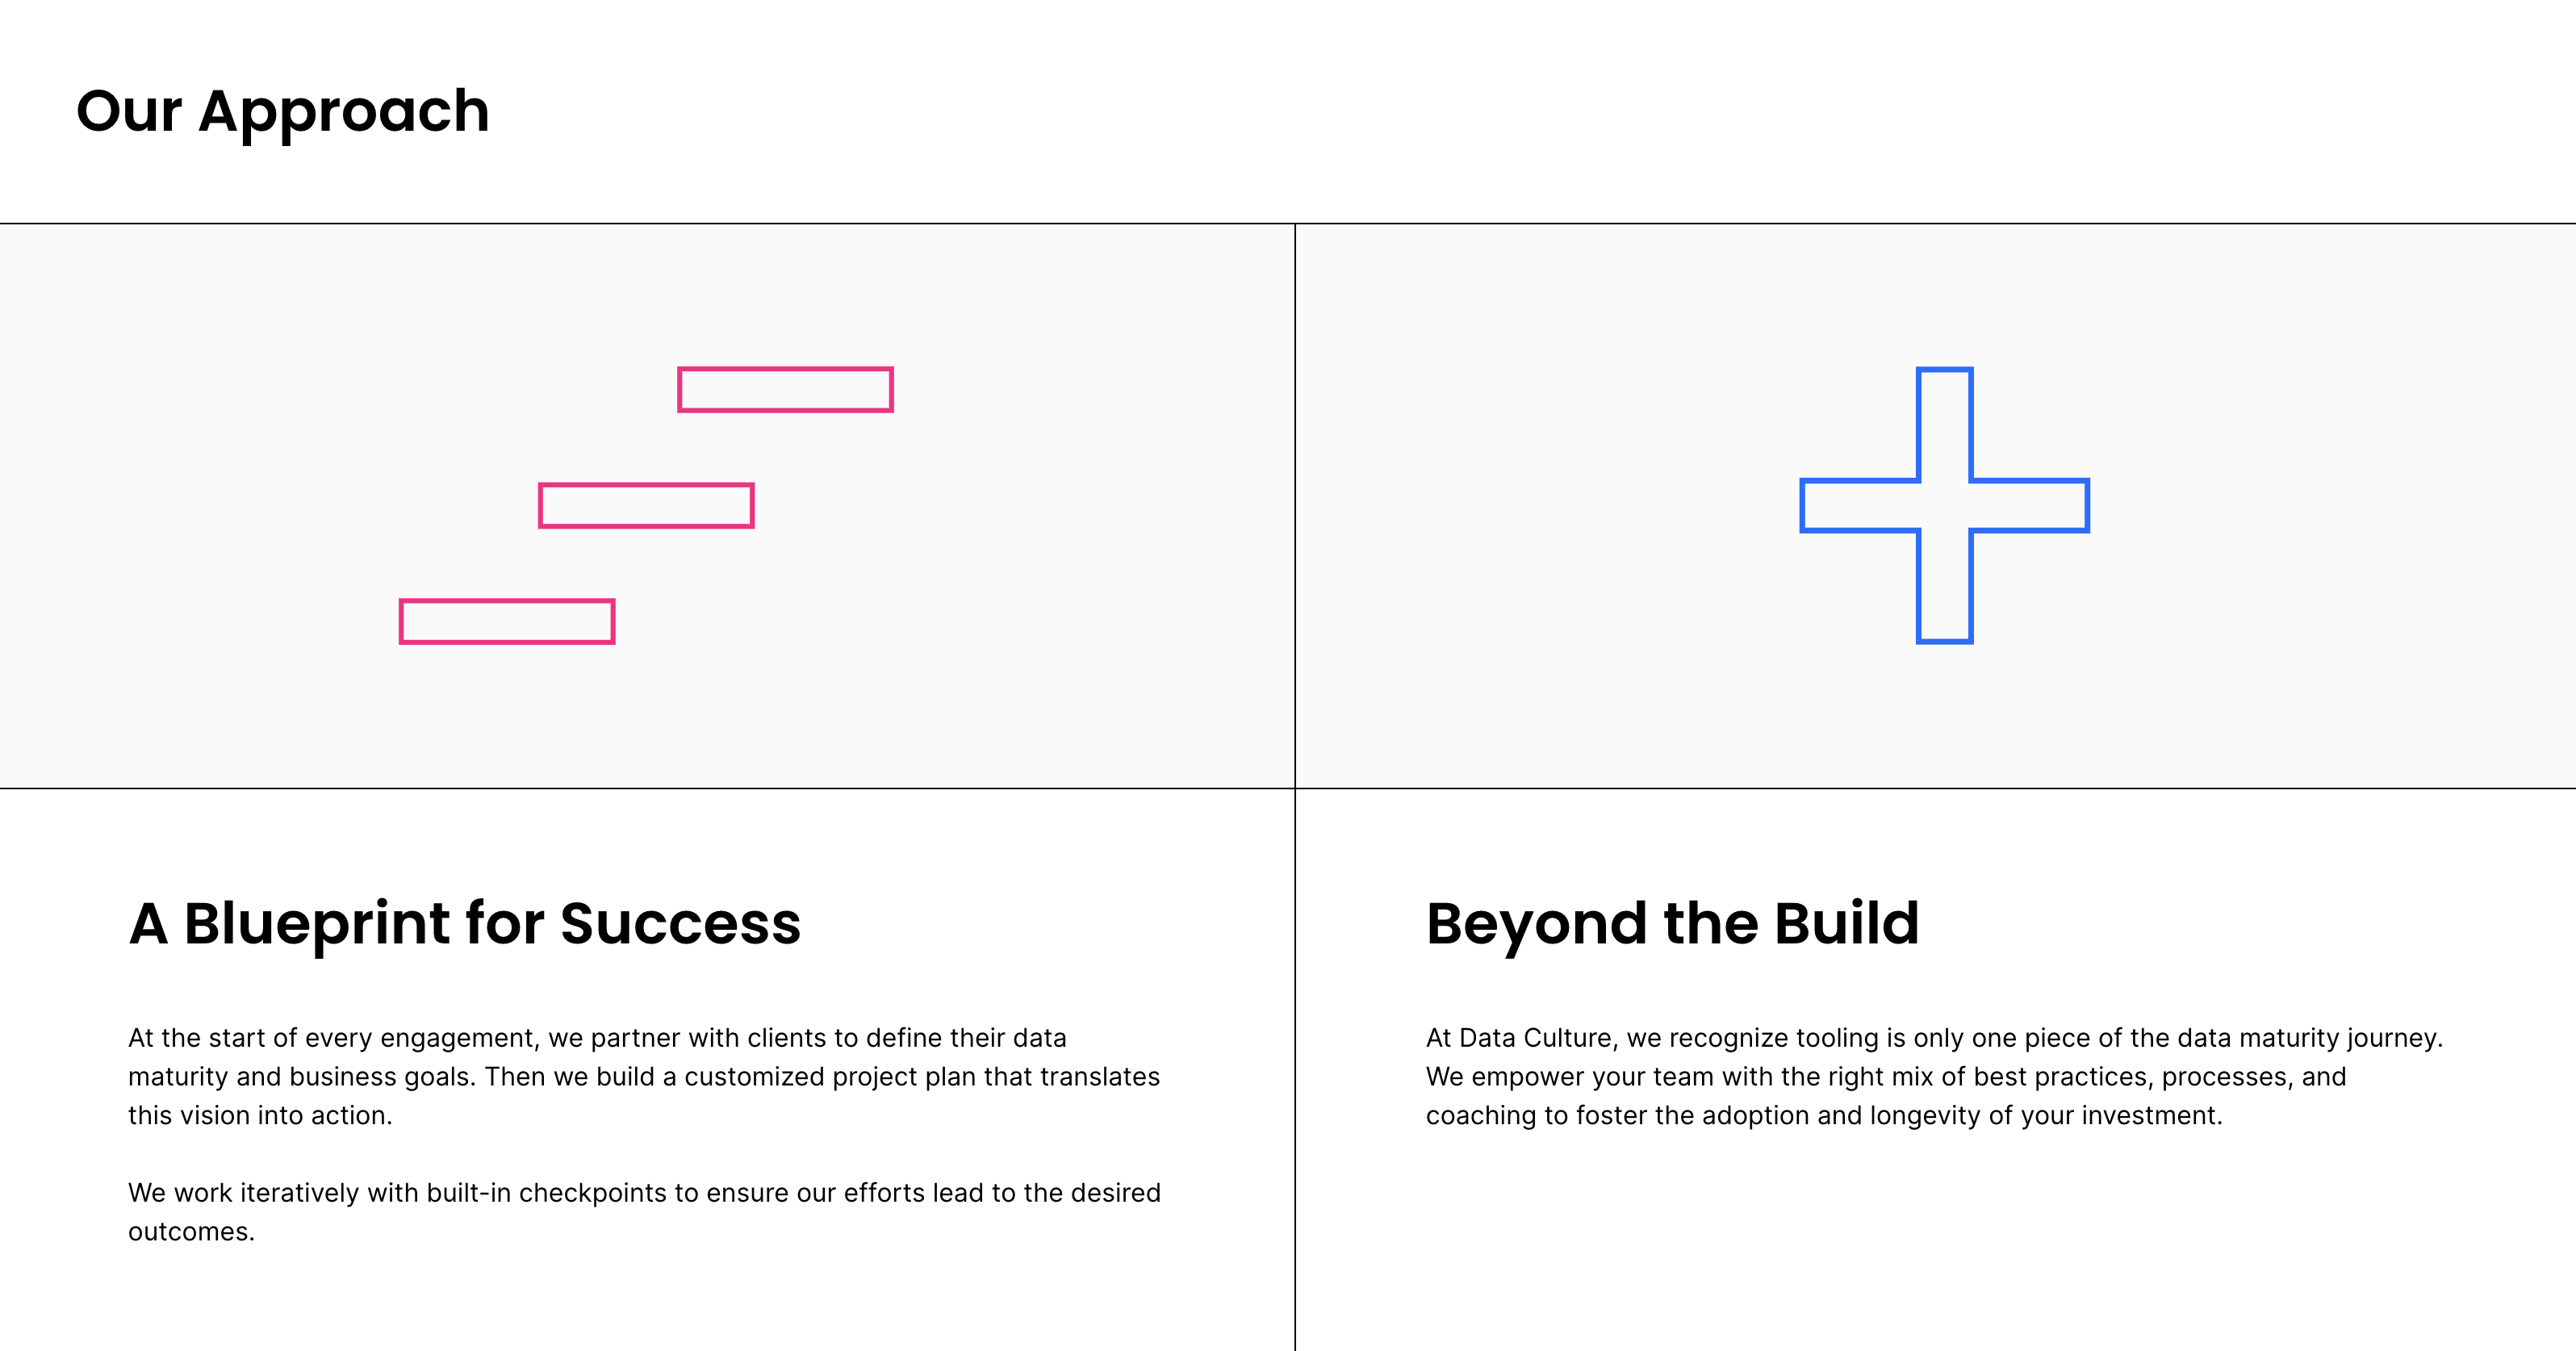
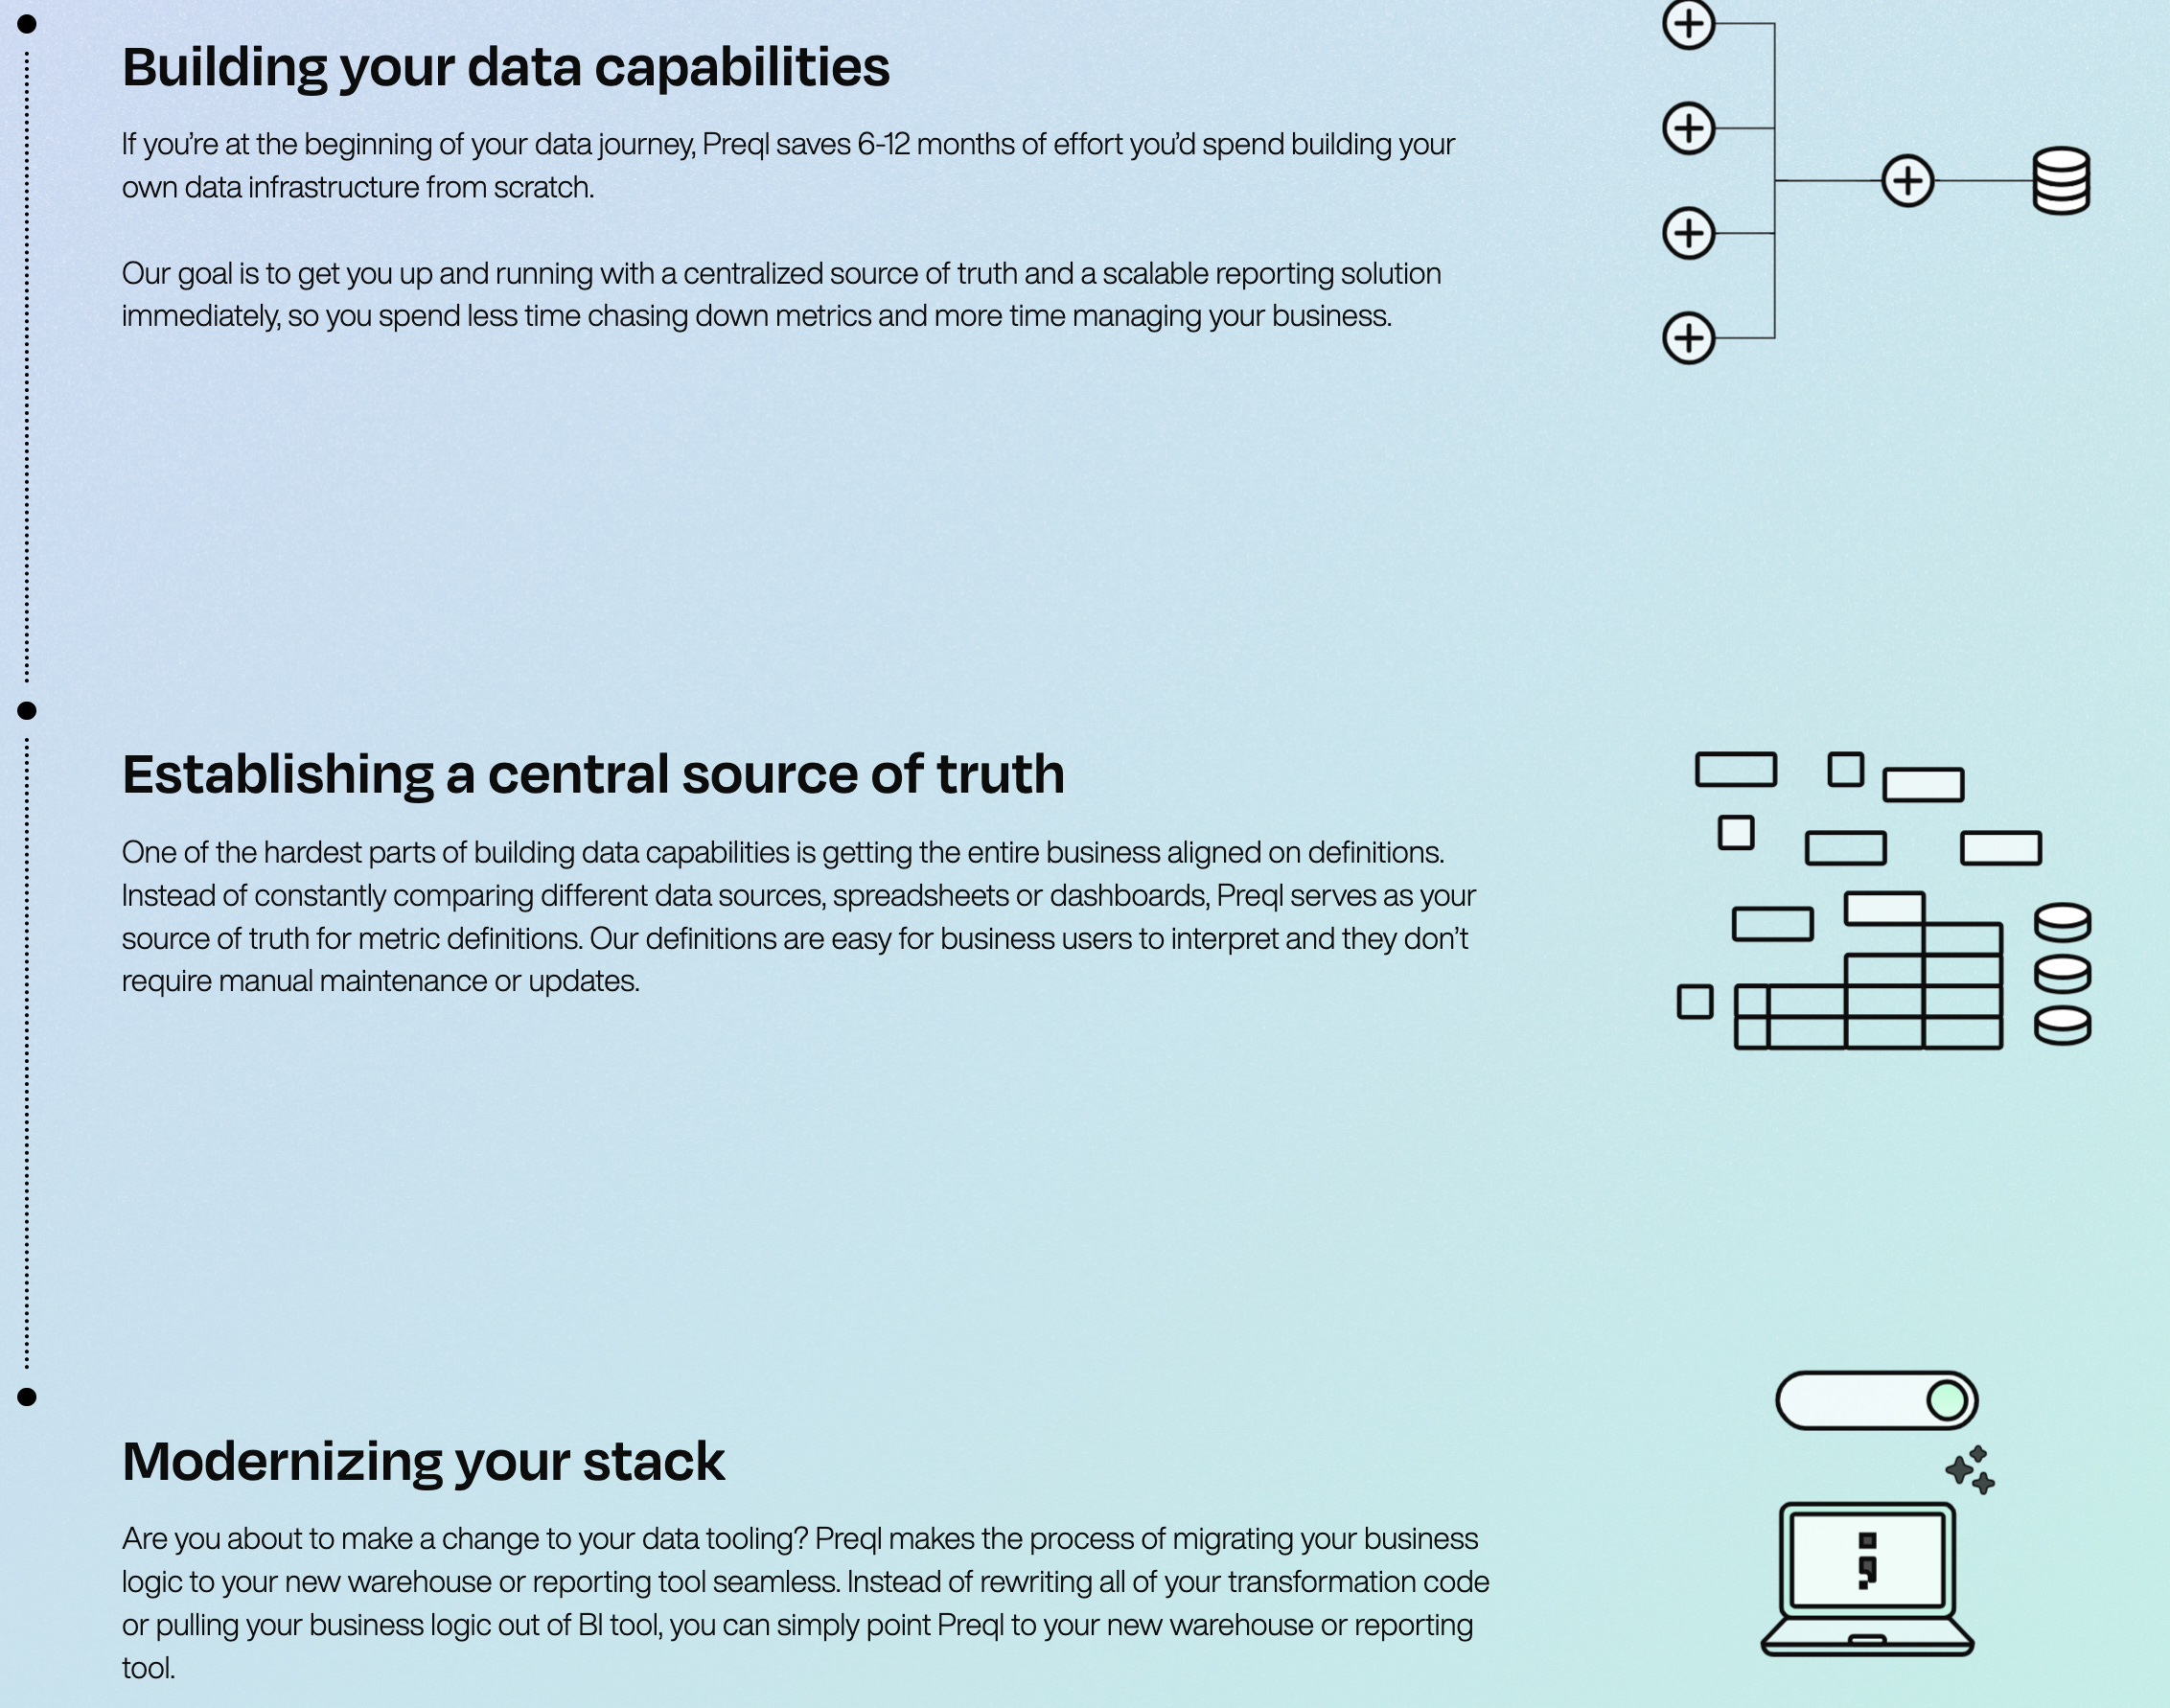
Data Culture is a consultancy that specializes in data engineering and visualization. We have a team dedicated to data visualization, and our core business is helping companies advance their data maturity, regardless of their current level.
We can set up a data stack for companies in the earliest stages of data maturity in just three months. This involves establishing cloud storage and a data warehouse, ingesting source data, structuring it using SQL, implementing an open-source solution like dbt, and setting up visualization and reporting.
Our initial package is suitable for those who do not yet have a data warehouse. If you already have a data warehouse, you may need assistance with data modeling or implementing Looker, a new BI tool, or a different ingestion solution. We structure custom engagements to suit your needs, although core packages are also available for sale.
We are passionate about empowering our clients on the business side, the data team, and whoever has hired us. We avoid black box systems and want our clients to understand the work we've done. We explain why metrics are structured in a particular way, what code has been written, and how the stack looks. We sell data teams, not just engineering hours, and our team comprises engineers, project managers, and strategists who work together on every project. We also provide teaching and education services.
This is what makes Data Culture's offering unique.
On Scoring Partnerships

All of Data Culture's early business came from partnerships with Fivetran, Looker, dbt, Snowflake, and other companies in the modern data stack. These partnerships were crucial for our success. At WeWork, we had implemented these tools and completed migrations, so Leah had seen every version of the data team evolve.
From the beginning, we knew the best tools for the stack. During our first implementation project, we contacted these companies and said we wanted to use their tools to do our work. Eventually, these partnerships grew more sophisticated. There is a great synergy between consultancies and data partnerships.
For many companies, bringing in consulting services is the best option rather than hiring a robust analytics engineering team. Many companies don't need such a team moving forward, and it's better to take on fractional support and own it.
This was the premise for why we started Preql.
On Data Storytelling as a Service
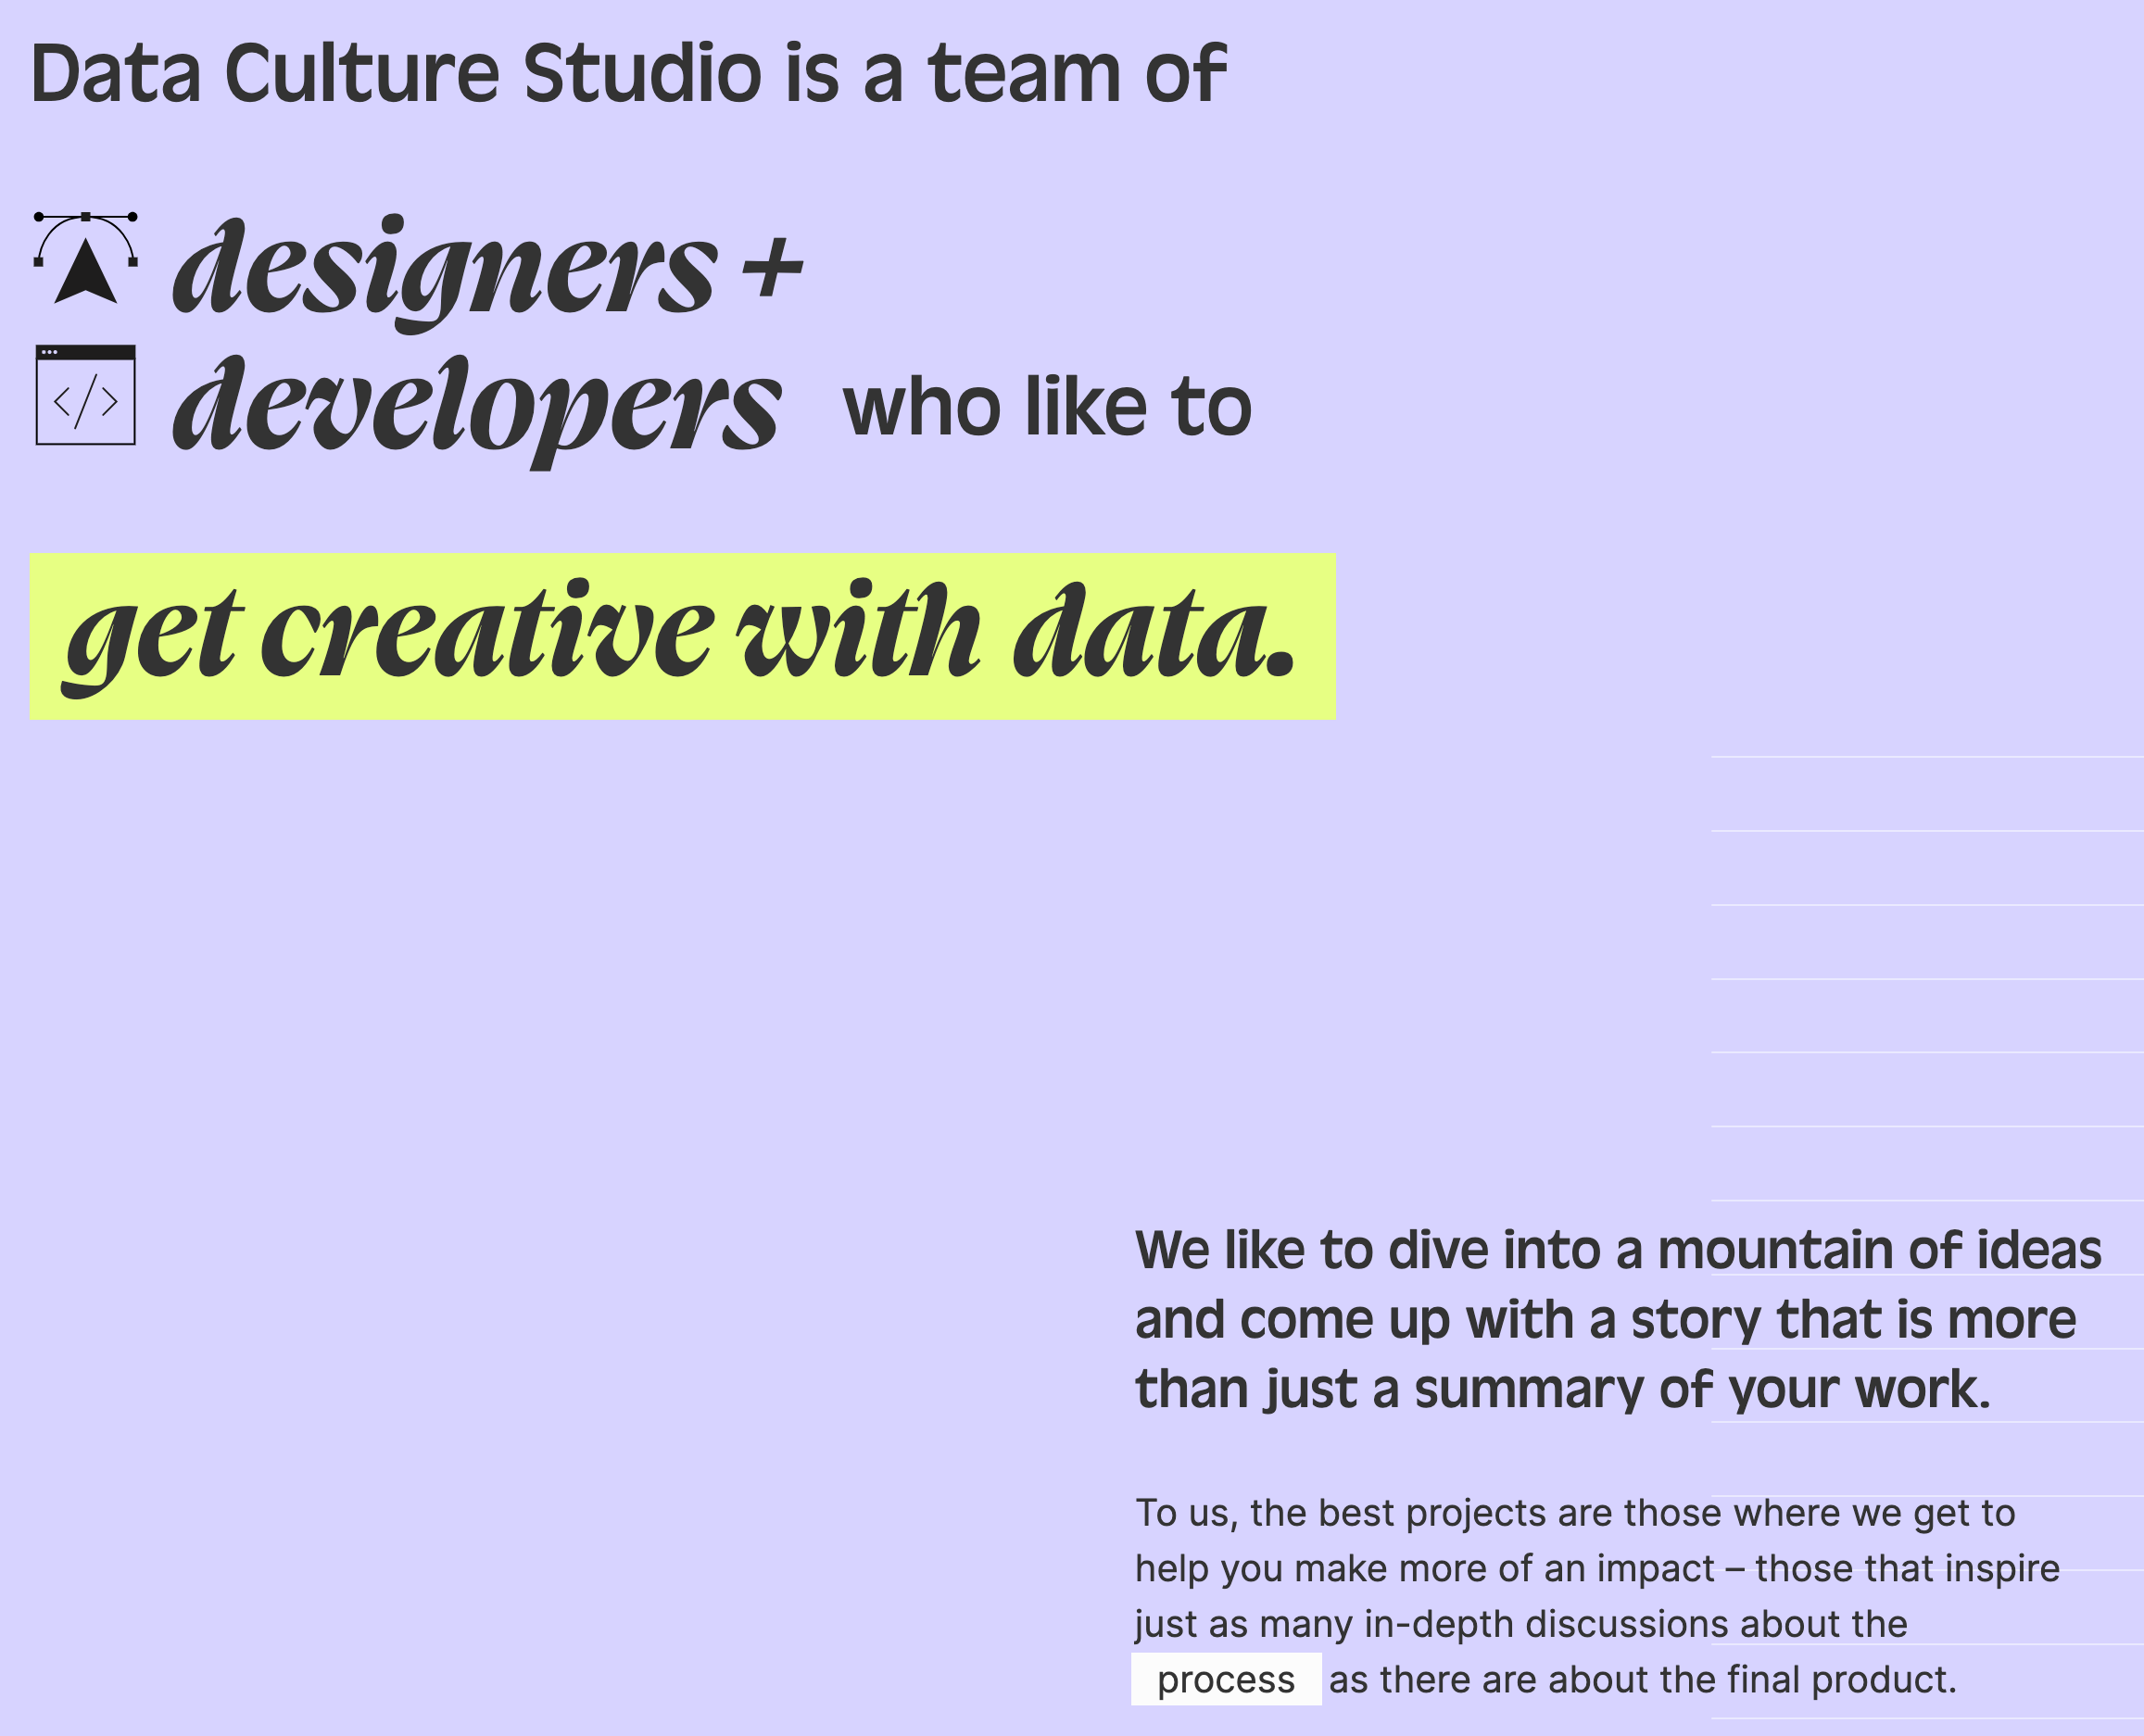
One of the unique aspects of Data Culture is our visualization studio. While this might be an advertising arm or its own entity for most organizations, the Data Culture visualization studio is a part of the same company.
The team in the data visualization studio is exceptional, and I'm proud of what they've accomplished. Today, they come up with creative solutions for projects and visualizations that companies may need. The earliest project they worked on was visualizing DNI data for portfolio companies of a VC.
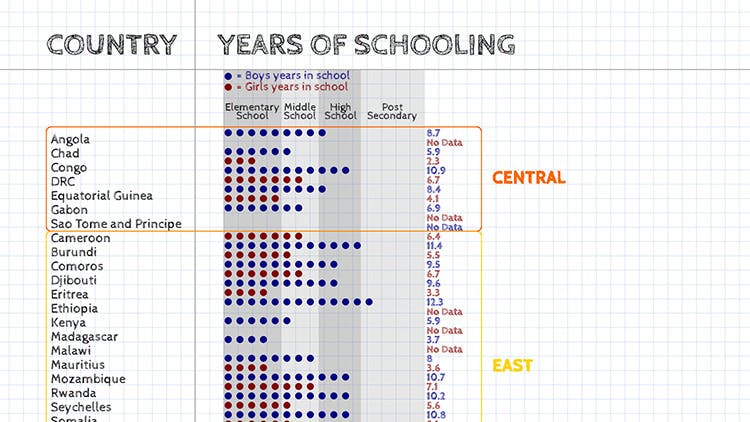
Currently, the data visualization team works on a variety of projects. We did the vote.org 2020 impact report, which is the core of journalism, visual storytelling, and visual scrolling. These custom websites, web applications, and design pieces that we produce are excellent, and the data visualization studio team is amazing at it. Many companies require it for external-facing pieces, like the vote.org piece, or for internal purposes, like the client Seatgeek, who needed a hyper-visual internal dashboard that required that type of skill set.
In my opinion, they are the top team when it comes to building this type of work. If you have any inquiries, you should reach out to them at dataculture.studio.
On Working with Kode with Klossy
Our friend Avi Flombaum, one of the co-founders of the Flatiron School, a company acquired by WeWork, referred Kode with Klossy to us. We had previously met during that time, and he recommended us to create their data science curriculum.
Previously, Kode with Klossy offered web development and mobile development courses, but they have now expanded to include a variety of other courses. Our team designed their initial data science curriculum, which included data visualization, and we also taught it. This amazing initiative is a nonprofit spearheaded by Karlie Kloss, who is passionate about helping young women and young people enter the coding space. The data science curriculum is free and offered during the summers, with plans to offer programs year-round.
The program is offered several times throughout the summer and is open to 13 to 19-year-olds, running for two weeks. We have now graduated hundreds of scholars, and instructors are trained to teach the course. In the program's first iteration that Leah and I taught, we had students access open-source data from New York City, such as the number of trees planted or 311 and 911 data. Many amazing initiatives and projects were created, including COVID-related projects.
We encourage young women, non-binary individuals, and everyone to enter the data and technology space. The Kode with Klossy initiative has produced exceptional projects, some of which can be accessed online. Scholars create these projects in just two weeks with very little support, showcasing their impressive skills and potential. The program aligns perfectly with the Data Culture program that Leah and I have been running with professionals at WeWork and other organizations.
On Scaling Data Culture
The thing about data culture is that very few organizations have accomplished it, and there are many reasons for this. The main reason is that it's really hard to have data accessible to business users. It's technically and culturally challenging to get people to buy into the idea that these numbers are the trusted ones to use when making decisions.
Putting those numbers in front of people at the moment of decision-making is much harder than it seems. It's very rare for most companies that are not Spotify, Netflix, Facebook, or Google to succeed. These companies collect data on their users and put it back into their products.
Suppose you're not one of those big companies. In that case, you probably have source system application data from all different applications that you use to calculate even the most basic metrics, such as customers. To tackle this problem, we've focused on educating and training employees to understand the value of data, how to access it, how to use it to make the right decisions, and where to find it.
The goal is to make data accessible and to structure problems in the right way. The curriculum we teach is about structuring a problem statement versus teaching SQL. We believe that if every person in your organization could write SQL, it wouldn't necessarily change the bottom line. What's important is making sure everyone in the organization can structure a clear problem statement and ask for support from their data team.
On the technical side, there are excellent tools available today. Since Redshift was introduced in 2012, data warehouses have become super fast. You can ingest data in minutes and visualize it with any number of tools. There are great business intelligence experts that can build any dashboard for you, but it's up to you to ask the right questions that the dashboard can answer. This requires a combination of technical skills and soft skills such as people skills, culture, and community. Having data ambassadors on every team can also help push data culture forward, and we've seen this be most effective in companies we've supported over the years.
On Founding Preql
Throughout my career, and especially during my co-founder relationship with Leah, we've faced the challenge of structuring data in a usable way. We've encountered questions like, "Why don't the numbers match?" or "Why aren't people making data-driven decisions?" or "Why can't business users better access core metrics, basic metrics, such as how many customers we have or what our net revenue is?" We've experienced this issue frequently during our time at Data Culture and prior at WeWork, and many people who have come to work with us have also encountered this issue.
The gap between the data team and the business users is a significant challenge. Business users often don't understand why the data team isn't working faster, structuring things better, or why the numbers don't match. Conversely, the data team is trying to get answers from the business user on why they want to structure things a certain way. Explaining that things take time and that metrics rely on writing a certain number of lines of SQL to transform raw data, which comes from different sources, can be difficult.
Instead of trying to do something flashy or fun in the database space or going deeper into education culture, we decided to focus on the most challenging part of the problem: transformation. It's the T in ETL, requiring hundreds of lines of SQL to be written. We didn't want to create a GUI on top of SQL but rather something that truly fit into the workflow of business users while also generating clean schemas on the back end. Data teams often rip out tools that do the work for the business user because they don't expose any of the logic behind it. We cared about transparency, empowerment, and no black-box systems.
We felt like nothing was out there in the market, and we were waiting for someone to build this thing. We've been doing this with Fivetran and Snowflake, but no one was building it. So eventually, we felt like we needed to tackle the problem ourselves. We believed, and still believe, that there is a product automation solution for structuring data.
Preql comes from the idea of the prequel to analytics - it's like the first step in your analytics journey. It's not the data science side of things, but rather the first thing you must do once your data is all in your warehouse. People often don't realize that they need to structure their data. We hope to help many companies do that without actually writing SQL themselves but by having clean schemas.
Our logo is also a SQL reference. When you write a line of SQL, you put the semicolon at the end to acknowledge that it is now a completed executed statement. We're hoping to help a lot of companies achieve this without actually writing the SQL themselves but by having really clean schemas.
On Working with Design Partners
We are in beta and plan to launch the public version at the end of 2022 or early 2023. We have experienced firsthand that product-market fit is a problem, and we need to figure out if this product will solve problems for all organizations within a given vertical.
Our design partners are waiting for the right solution to be put in their hands. The early product does solve many of their problems. However, the real challenge will be working with more complex data sources and verticals to see if it can scale. We know we can build something on the back end that will work for all organizations within the DTC marketplace, but can we build a model that structures any data and generates the right metrics automatically?
On the back end, we feel pretty confident. The design challenge is more difficult, as we need to put something in the hands of business users who ask the right questions to structure the data that fits into their workflow intuitively. Unlike many early companies, we are design-led and product-led, with a robust design team. We are excited to put our product in the hands of more people and start solving this massive pain point.
Data transformation is often an overlooked problem, and not all businesses realize that their numbers don't match due to a lack of a data model or an inconsistent data model. We will be evangelizing the issue of data transformation next year and trying to get more people up to speed on how to be data-driven and make better choices based on the information within their company rather than just intuition.
On Hiring

Data Culture comprised 70% women and people of color, and achieving this was not as difficult as one might think.
There are numerous ways to intentionally hire teams that are representative of the population, such as ensuring that every interviewee is not a white man (who currently make up the majority of people in my inbox). It is possible to do this. We also partner with exceptional recruiters who actively seek out qualified candidates because they are out there. The idea that there aren't enough female engineers is a misconception. It's simply not true. And we have been quite successful in our hiring efforts.
Recently, we made another amazing data engineering hire, and we plan to continue diversifying our team as the organization scales. We do not want a typical sales organization filled with people who look the same as many others. Unfortunately, we have also experienced a lack of diversity in the VC world during our fundraising efforts, which is one of the least diverse spaces I have encountered.
On Striving For Diversity

I believe the main bottleneck is the lack of intentional thinking. People tend to take the easy route instead of putting in a little extra effort, even though it's not that difficult. It's disappointing to see so many VC firms wanting to invest in us, but their teams are 100% white men. They assume they can offer us unique and fantastic advice, but it's really not that interesting. I'm excited to see how the industry will change because it's already starting to.
I think our lack of intention has brought us to this point. It's the repetition of bad behaviors and cultures that exclude diverse voices. Leah and I, as co-CEOs, have gone out there to challenge that. We talked about our partnership and fundraising journey in a podcast with our partners at Bessemer. We were told that having two co-CEOs is uncommon, but it works for us. Of course, it won't work for everyone. Entrepreneurship for us means doing things our way and creating an organization that we want to be a part of.
I hope that others who may not be represented in the typical way companies and VCs are will be inspired to create their own companies that reflect their identities. It doesn't take much to be intentional and committed to hiring teams that are reflective of the population. Starting a company may not be easy, but building a diverse team is much easier than people think.
On Fundraising
I was really set on having a few data founder leaders in our corner and getting their seal of approval. So, I think it's essential to find the people who inspire you and talk to them. Whether or not they become your investors, it's not that important because investors don't always give you their time, and you don't need their time. Building your product requires you to be left alone.
However, having a few people in your corner is still great. Fundraising isn't only about meeting big-name VCs and asking for money with a nice story or pitch deck. If you understand the problem space you're getting into and have a vision for what you want to build, it's pretty straightforward. People will get on board.
We thought it would be more difficult than it was because we were over-prepared. We were fundraising in a space about a problem that we knew so deeply. Instead of kicking around ideas you think might be a good idea or a VC might like, find something you're passionate about that you are uniquely well-suited to tackle and solve.
Find partners you want to work with and talk to, and then the path unfolds for you. Things go wrong for founders when they're always trying to please someone else or think about what a VC would like or what another customer might want, but they don't know that customer. You need to trust your intuition and knowledge base and lean into that rather than guessing what other people might want or think.


Share this post